Whether collected using the times mode or the samples mode, Mike's Java Profiler accumulates statistics for each unique call trace. A call trace represents the contents of a thread's call stack at a moment in time. For example, see Example 4.1, “Simple Program”. We'll pretend we are profiling this program in times mode.
Example 4.1. Simple Program
public class Test {
    public static void main( String args[]) {
        a();
    }
    public void a() {
      b();
      c();
    }
    public void b() {
      d();
    }
    public void c() {
      d();
    }
    public void d() {
    }
}
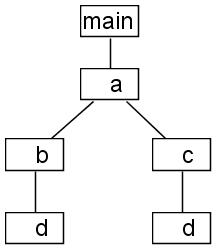
When the method main is called, MJP notes it by pushing a frame onto a special stack associated with the current thread. The method call start time is recorded in this frame. When method a is called, another frame is pushed onto the stack and the start time is recorded within it. This continues until method d exits. When that happens the difference between the current time and the start time of d is calculated. This is called the elapsed time. MJP then looks at the special call stack. The contents of the call stack make up call trace. In this case the call trace consists of main, a, b, and d. MJP looks into a special data structure and determines whether it has seen this call trace before. If it has, it adds the elapsed time to the current value. If it hasn't it creates a new node in the data structure and sets its value to the current elapsed time. The key here is that time is accumulated on a call trace basis, not on a method basis. This fact creates a tree data structure where each node is a stack frame. This data structure is called the call tree. After the example program runs to completion the data structure looks like Figure 4.2, “Call Tree”.
One important thing to note in Figure 4.2, “Call Tree” is that d appears twice. That is because main-a-b-d is a different call trace than main-a-c-d. This fact will be important later.
The data structure produced by samples mode is exactly the same, but instead of storing wall time, CPU time, and the number of times called for each call trace, the number of samples is stored.
MJP provides two ways to view the collected data: the tree view and the graph view. These two views will be described in the following sections.
The tree view is a direct view of the call tree as collected by the profiler agent and shown in Figure 4.2, “Call Tree”. As noted above, each node in the call tree is a stack frame and each stack frame has an associated method. The tree view allows a very detailed look at the performance of the application. To access the tree view, first select a thread from the thread list and then double-click on a root stack frame.
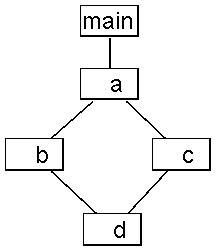
The graph view is a transformation of the call tree into a graph structure where each node is a method instead of a stack frame. Each node contains a summarization of all stack frames associated with the method. For the program in Example 4.1, “Simple Program” the graph view looks like Figure 4.3, “Graph View”
The graph view is handy when all available information about each method is important. However, one cannot differentiate between separate call traces. To access the graph view, select a method from the method list.

