This chapter explains how to make sense out the data collected by Mike's Java Profiler. I will first describe the two modes of data collection, times mode and samples mode, and then I will describe the two ways of viewing the collected data, graph view and tree view.
Mikes's Java Profiler has two data collection modes: times mode and samples mode. Times mode times each and every method call in the application. Samples mode records the contents of each thread's call stack periodically. Times mode collects more information but has a lot of overhead. Samples mode collects less information but has a lot less overhead. In the next sections I will describe these two modes in greater detail.
Times mode works by recording the difference between the begin and end time of every method call in the application. Both the total amount of elapsed time and the amount of time spent using a CPU is recorded. The first measurement is called wall time and the second is called CPU time. Besides the time measurements, the number of times each method was called is also recorded.
Wall time is simply the difference between the begin and end times of a method call. The term wall time was borrowed from somewhere now forgotten. It refers to time as recorded by a clock on the wall. In actuality, the time is measured by a high resolution clock on the CPU or motherboard (e.g. the RDTSC instruction of a Pentium CPU). This is implemented on Windows by calling QueryPerformanceCounter() and on Linux by calling gettimeofday(). One should note that even though these timers have a theoretical resolution of microseconds, the true resolution is determined by the operating system's time slice length which is usually 10 ms. The time slice length is the amount of time a process gets run on a CPU before it is preempted and another process is allowed to use the CPU. Therefore, depending on how busy the CPU is, it could be multiple time slices between the time an event happens and the time it is recorded. This preemptive behavior also means that your application may have spent all of some of the recorded time waiting for other processes. You can mitigate these effects by profiling your application on a machine that is otherwise idle. Wall is also made inaccurate by the profilers own overhead. A profiled application may run 4-5 times than when it is not being profiled. Any analysis of wall time was take this into account. It's deficiencies aside, wall time is useful for measuring the "real" time used by the application, whether that time was spent on the CPU, waiting for locks, waiting for a CPU, sleeping, or other activity.
CPU time is amount of time the thread spent using a CPU. It does not include time spent waiting for I/O, waiting for locks, waiting for a CPU, sleeping, etc. CPU time is measured by calling the JVMPI function GetCurrentThreadCpuTime(). I have not looked at the source code for this function, but I suspect it simply multiplys the number of operating system time slices used by the thread by the length of a time slice (usually 10 ms). As I said in the previous paragraph, the time slice length is the amount of time a process gets run on a CPU before it is preempted and another process is allowed to use the CPU. Because CPU time is restricted to time spent actually using the CPU, it is immune to the effects of CPU contention. You can profile your application on a busy machine or an idle machine and you should get the same approximent results. However, you will have no idea how much time the application spent waiting for I/O, waiting for locks, or sleeping. CPU time is most useful for profiling CPU intensive applications.
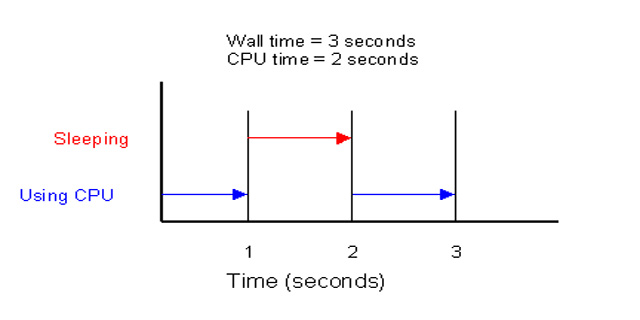
To illustrate these concepts consider Figure 4.1, “Wall Time and CPU Time”. The diagram shows the activity of a method. First the method spends 1 second using the CPU, then it spends 1 second sleeping, and finally it spends 1 second using the CPU again. MJP would report 2 seconds of CPU time and 3 seconds of wall time.
Times mode provides a lot of juicy information. However, the juice comes at a price. An application profiled with times mode will run 4-5 times slower than when it is not being profiled. Not only does this skew the results, but it also tries the user's patience. Additionally the information collected can consume a large amount of space: many megabytes of disk and RAM. If this becomes a large concern for you, check out samples mode. It trades information for performance.
Whereas times mode is fairly deterministic measurement, samples mode is completely statistical. It works by sampling the contents of each thread's call stack at a constant rate (e.g. 100 Hz). In each sample the method associated with top stack frame is noted. This is the method that is currently executing. If you take enough samples, methods which take longer or are called more times will tend to be at the top of the call stack more often and thus will be charged more samples. Since this profiling method does not profile every single method call, it consumes far less resources than times mode. However, it does not provide information about how many times a method was called or how much CPU time it consumed. Additionally, fast or seldom used methods might not show up in the results at all. This might or might not be what you want.
